Definition
Internal actions are unseen forces that act in the interior of a body. They can be:
- Normal (axial) force
- Shear (transverse) force
- Bending moment
To find internal actions, we use sectioning: cutting a body into two parts across a cross-section.
Internal actions MUST vanish when summed up!
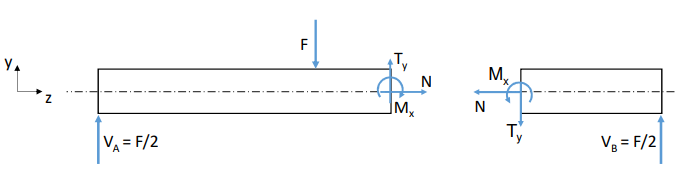
Cross-section-local coordinate space conventions
A positive cross-section has beam axis z going outward the body, while a negative cross-section has the beam z-axis going inward.
The Diagrams
The Goal
To determine the internal forces () at every single point along the beam’s length (). This tells us where the structure is weakest (the “Critical Points”).
A. The Setup (Method of Sections)
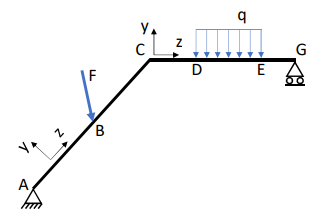
1. Define Coordinate System (): Place an origin (usually at the left end, A). The variable travels along the beam axis. 2. Identify Discontinuities (Segments): You cannot write one single function for the whole beam if the loading changes. You must split the beam into segments wherever:
- A concentrated force or moment is applied (Point B).
- A constraint exists. (Points A, G)
- The geometry changes. (Point C)
- A distributed load starts or ends. (Points D, E)
B. Cutting the Beam
Step 1: Sectioning Pick a segment (e.g., Segment AC, where ). Imagine cutting the beam at an arbitrary distance .
- Rule: Discard one half (usually the right). Keep the other (usually the left).
- Expose Forces: Replace the cut part with unknown internal forces: Normal (), Shear (), and Moment (). Step 2: Equilibrium of the Cut Piece Write equilibrium equations for just that isolated piece to find functions for .
- (Repeat for the next segment, e.g., CB)
C. The Results (The Diagrams)
NOTE
The diagrams below are not related to the one above! Instead, they refer to this one:
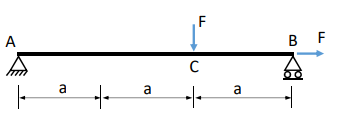
Once you have the functions, you plot them. These plots reveal the physics of the beam.
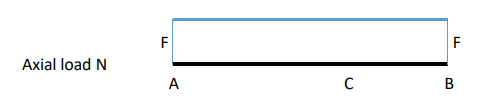
1. Axial Load Diagram ()
Shows tension (+) or compression (-).
- In this example, it is constant ().
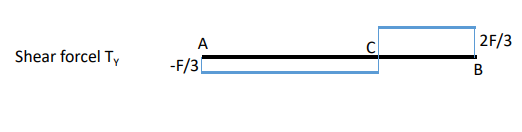
2. Shear Force Diagram ()
Shows the force trying to slice the beam vertically.
The Jump Rule
At Point C (where force pushes down), the Shear Diagram JUMPS exactly by the amount .
- Discontinuities in load = Jumps in Shear.
3. Bending Moment Diagram ()
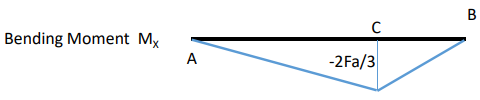
Notice that the above shear force diagram is the derivative of this bending moment diagram!
Shows the bending effort. This is the most important diagram for failure.
- Key Insight: The moment is Zero at free ends (A and B).
- The Peak: It peaks under the load (Point C). This is where the beam snaps ().
Properties of Diagrams
The Power of Derivatives
You do not need to cut the beam 10 times. The shape of the diagrams is mathematically predicted by the loads.
- Load () determines the Slope of Shear ().
- Shear () determines the Slope of Moment ().
A. The Differential Rules
These rules apply to every infinitesimal slice of the beam ().
1. Slope of Shear = -Load
- Translation: The value of the distributed load tells you how steep the Shear diagram is.
- Example: If (no load), the slope is 0 (Shear is horizontal).
2. Slope of Moment = Shear
- Translation: The value of the Shear tells you how steep the Moment diagram is.
- The “Order” Rule: The mathematical order increases by 1 each step.
- Load: Constant Shear: Linear Moment: Parabolic.
B. The “Graphical Method” (Sketching)
Use these relationships to spot errors or sketch rapidly.
| Feature | Effect on Shear () | Effect on Moment () |
|---|---|---|
| No Load () | Constant (Horizontal Line) | Linear (Slope = ) |
| Uniform Load () | Linear (Sloped Line) | Parabolic (Curve) |
| Point Force () | JUMP (Vertical shift by ) | Kink (Change in slope) |
| Couple () | No change | JUMP (Vertical shift by ) |
C. Finding the Critical Point (Max Moment)
Critical Rule
Since , the Maximum (or Minimum) Bending Moment occurs exactly where the Shear Force is ZERO.
Strategy: Do not calculate moment everywhere. Find where crosses the axis, and calculate only at that specific point.